POLITICS
INFO
Possibly of interest to other Wisconsinites.
On the site My Vote Wisconsin
you can get both past and present information concerning your voting. This includes information
about current absentee voting for the 2020 presidential election.
Mine shows that my absentee
ballot should of arrived around Sept. 17th, which it did. It now shows that my returned ballot
was received yesterday Sept. 22.
I VOTED
My thanks to the Municipal clerk for the Town of Hudson, St. Croix County, and all
involved for permitting a fair and honest election.
So far these all involve using the R language and RStudio to do some data analyis
related to politics. This is also an interest of mine. A skill I am attempting to work on
a little bit although I am no expert.
The R source and datafiles are on github. Links will be provided for each project.
Election 2024
Electoral College vs. Popular Vote 2+ Revisited Again
Ya can't tell the players without a scorecard
I was watching the news and there was a Trump rally in North Carolina. I wondered, what
could what I had done tell you about North Carolina and why Trump might be there. It shows
that in 2000 North Carolina wasn't a swing state. In 2016 it was 10th (closest) in swing
states and went Republican with them showing a greater distance gain in turnout. In 2020
it was 5th (closest) of the swing states. It again went Republican but showed a greater
turnout gain for the Democrats. Explaining it's move up the swing state list, it got
closer. With 16 Electoral College representatives (2024, 2020 shows 15), it would be a state
Trump would want to hang onto. With it's closeness and seeming Democratic trend it could be
a state the Harris campaign would want to 'put into play'.
I thought more content on interpretation of the data could be useful. That it might be
handy as a reference for election related as things progress.
Interpretation
One thing I thought was that maybe the data on 'distances' wouldn't immediately make sense.
So I added the actual turnout percentages in the swing state section. You can maybe see
how close the very first swing states are. Usually not more than a tenth or two of
a percent separation.
The PvEC_2 Swing state related...
Swing States
And Turnout
It seemed that it might be interesting to know if these differences were consistent election
to election. I broke each of the three swing state section elections into three
'closeness' ranges, 1:5, 6:10, 11:15.
Originally I did this only for the two states of interest for
PvEC, 2000 & 2016 plus I also added 2020 as the latest and I thought more typical election. Looking at that
shows that the 2020 numbers were larger.
Sometimes in doing this I have wondered if it doesn't just always boil down to number of
votes. The more votes the bigger the numbers for whatever you look at. That could be the
case here since the 2000 and 2016 were clearly closer.
Turnout and Polarization
Although, it could also mean that the 2020 results were more
polarized. Possibly, this
could be determined if you looked at more elections. I did this and got the following,
reproduced from the link above.
Swing State Turnout Differences In
Ranges
##       Year        1_5      6_10     11_15
## tdiff 2000  0.1311604  1.590966  2.680234
## X     2004  0.6980677  2.082592  3.697898
## X.1   2008 10.7027048 16.885724 11.887326
## X.2   2012  9.4495818 14.396069 10.566800
## X.3   2016  0.4241536  1.757940  3.915853
## X.4   2020  0.4987496  2.775959  6.052002
The first thing, that got at least my attention, is the Obama elections. Again, the states
included in these averages are the closest by votes in order but the values shown are the
difference in turnout for those states. It seems that even in the closest states there
were very large differences in turnout for the 2008-2012 elections. These don't look like
outliers, they look like anomalies. This suggests that it isn't just simple number of
votes, but where those votes are doesn't necessarily coincide. I've probably put
too much time into this already, but I should probably try to verify these numbers.
They seem hard to believe. If true this would seem to suggest extreme polarization, there
were no close states.
Returning to the original question of whether or not the Biden-Trump election showed
polarization. Maybe. Certainly not on the scale of the Obama elections, but as the states get less
close there are larger differences in turnout, which would be electorate polarization.
This would mean one or the other party is outperforming for turnout in most cases.
Which in turn would make swinging or flipping the state that much less likely.
Swing States and Campaign Appearances
It has seemed to me, and this is an impression, that the candidates for this election
have been concentrating on very few states for appearances. The closest of the swing states.
Wisconsin, as I've mentioned, we rock the vote for turnout but are also consistently a very
close swing state. Refer to the link above, we were top 5 in all three elections, 3rd in 2000,
4th in 2016, and 3rd again in 2020. Then Pennsylvania, 3rd in 2016, 4th in 2020. Finally, the
appearances in North Carolina, 10th in 2016, moved to 5th in 2020. These are the states
I've mostly been aware of, just following the news a little bit, where the candidates have
been making appearances. I have checked a little for mention of appearances in other places
but didn't really find any.
There could be various reasons for limiting appearances to the closest of the 2020
swing states. Given Harris assuming the top spot in the Democrat ticket there has been
talk that the remainder of the election is a 'sprint'.
Maybe the campaigns are trying to get a jump in these states and
will spread out later. Maybe beyond the top 5 closest the rest are in fact considered too
polarized to flip. Maybe with nation wide media appearances are considered less important.
There is also the internet, Trump with social media and my understanding is Harris has
some content and support online.
Maybe these states have been calculated to be the "key battleground states" that the
election will hinge on.
One thing I have found sort of surprising is that no one that I've heard about has been in
Georgia or Arizona. The swing state section shows these as 1 and 2 for closest in 2020.
Biden took both but it required a considerable gain in turnout. It definitely doesn't seem
a lock for 2024. I did hear the Democrats were spending money on ads in these states
despite them not being "blue wall". Neither is North Carolina. I remember one of the 2016
post-election criticisms claimed was that Hilary Clinton didn't spend enough time in the
states that she should of. I wouldn't take these states for granted on either side.
I did just hear that Robert Kennedy had appeared in Arizona to sort of weirdly partially
endorse Trump, so Trump has been there. Also this morning I heard Harris is going to be
in Georgia, so these states are not being neglected.
As I watched the DNC convention the states most often getting mentions include these two
and the others from the closest 2020 swing states as shown in the prior link.
So the swing ranking numbers seem to match up with the awareness of their importance at
the convention.
The Close And Electoral College Elections
I heard it said that in 2016 Hilary Clinton lost because she failed to excite the
voters. This seemed to me like accusing the victim. The numbers do provide some confirmation.
If you look at the 2016 election here
many of the Democrat turnout results were below average and in the top 10 the Republicans
had better turnout in every election. I tend to think of this more as a letdown from the
interest in the Obama elections rather than a fault in Clinton. I think this would have
happened with any follow-up candidate.
Choosing not to exercise your right to vote is a valid choice in this democracy. But,
don't come back later and say the dog ate your vote. I think if something unexpected happens
people want to come up with an explanation, or if its not good, an excuse.
If you look at the other two elections shown you see that in 2000 it shows turnout
down for both parties. Again, though the data isn't adjusted for population increases and
2000 would be at the far low end. The
data table shows that 2000 had the 2nd lowest "United States" turnout at 50%.
The summary section might again give an idea of the 'closeness'. 2020 was more a mixed bag
all positive, record turnout, some more Democrat some more Republican. The Democrats had
slight wins in the swing states in both 2000 and 2020 while losing big in 2016.
I'm not going to say you can look at the turnout distances I have and say what the
outcome probably was. I couldn't look at the 2016 numbers and say it seems Clinton lost
pretty big in the swing states. Some states show a party improving in turnout more than
the other while still losing the state. It is meant to provide a 'relative' estimate of
how turnout went. Did the state improve over average or get worse? Did the party improve or
lose turnout more than the other party? Can you tell to some limited extend if there is a
trend. A state becoming more or less swing. Anyhow, some information you don't get strictly from
number of votes for the year.
In 2020 the Republicans turned out in force. This time, however, the Democrats
responded in kind. It was a record turnout year. Given this, I believe the advantage
that the Democrats normally have, even with the Electoral College, handed them the victory.
Gerrymandering
My original idea concerning Electoral College only wins being caused by something like
gerrymandering wasn't correct. However I think the metric I tried - Gap Per Elector(GPE),
wasn't completely off the mark. From the
Gap Per Electoral College Representative(GPE) part of the link. Considering again both
Bush elections and the Clinton 2016 election. These show as the closest elections by both
popular vote and GPE. I still find thet 2004 election of more interest here than the 2000.
Wikipedia shows that Bush won by 2.4% of the popular vote. In 2016 Hilary won popular vote
by 2.1%. Bush won a clear electoral college victory while Clinton lost. Again sort of
suggesting the casino nature of the Electoral College. GPE is actually closer, less extra
votes in 2008 than in 2016. Also note that both distance measures
agree on direction, positive for a Democrat year, negative for a Republican. Except for
2016. GPE does show it as negative year, more gap or votes to spare for Trump. I think
somewhat as a surprise to many that he had found a constituency.
The GPE sort of combines information from popular vote and the electoral college. I
think there is unique information that can be interpreted from that which isn't just how
many votes.
As an after thought. When I was thinking the electoral college sort of represented a
gerrymandering situation for presidential elections. Since determined to be incorrect.
Still, I thought, a possible solution to make the Electoral Collega a fair system would
be the same solution for states to avoid gerrymandering. Redistrict it. Of course you
couldn't just change state borders to manage this. But you could probably come up with
something nation wide at the county level where you could get regional districts more
equitable than by states. Although, "Electoral District 72, Electoral District 72, Electoral
District 72" wouldn't have the same ring to it as "Florida, Florida, Florida".
That is farfetched and no one would go for it. Even though it could be a fix to make the
Electoral College system more fair. As it is I still believe that the Electoral College
system gives the Republicans a builtin edge in close presidential elections. I also
still think there would be an almost insurmountable edge for the Democrats if the elections
were strictly popular vote decides all.
The Republicans would rarely if ever win the presidency
on this basis. Both my simulations,
Previous simulations also including 2020, and historical results since 1992. The Historical is shown in
the summary from
the current update of what I had originally looked at for this.
The simulation results above show an 88% chance the Democrats win on popular vote. The prior
results which didn't include 2020 were actually Democrats winning 90.81%. The simulation
results are based on some randomness. Adding another Democrat popular vote win should of
made it more likely probabilistically speaking. The simulations also didn't include the
Bill Clinton Democrat popular vote wins in 1992 and 1996 which should of made Democrat wins
this way more likely. So it's sort of safe to say going by the simulations the Democrats
should win more than 9 out of 10 presidential elections.
Historical, the only time in the years considered that the Republicans won on popular was
the George W. Bush re-election. And that was a close thing as mentioned earlier. So an actual
1 out of 8.
I don't believe the Electoral College should not be abolished in favor of popular vote.
I believe in multi-party democracies. Minimum two parties. There should be representation
for opposing viewpoints. I think voter suppression is absolutely undemocratic and
unamerican. I think the Republicans totally gamed the Supreme Court justice selection process making
the rules whatever gave them an advantage. Which was hypocrisy. In turn, giving us possibly
the most partisan politcal court ever.
But, Republicans still represent the views and values of a lot of people and I don't think they should
be completely shut out of chances for the presidency. I believe popular vote only elections would just
about amount to that. If they never win the presidency we are in effect no he longer a two party
democracy, although there is more to the government than the presidency.
In Closing
So, to close with some entertaining type references. Stevie Wonder appeared at the Democratic
convention. I remembered the first place I had seem him was al little Stevie Wonder in the
old beach movies.
MUSCLE BEACH PARTY (1963) - (MOVIE CLIP) LITTLE STEVIE WONDER>
I remember now that they always had go-go dancers in these scenes. Hopefully happy street
is your street after the next election.
This one I hope won't be taken the wrong way. But the current Democrat theme of "We're
not going back" reminded me of this one.
Twirling, Twirling, Twirling
Towards Freedom! (The Simpsons)
Really, if it suits you to do so, feel free to twirl your way to freedom.
I thought I had some insight concerning the Electoral College only wins connected to
Gerrymandering. This turned out not to be the case. The results are similar to gerrymandering
in result only, not in mechanism. There are possibly some things of interest in the derived
metric - Gap Per Elector (gpe). Mainly using actual historical results I consider turnout
and again swing states.
New Content here...
Popular Vote vs. Electoral College 2024 - Part II
Electoral College vs. Popular Vote Revisited
I was originally going to do a rather simple update of my presidential election
simulations, just adding the 2020 results. I ended up doing a little more than that.
It still seems that presidential elections resulting in a Electoral College victory while
trailing in popular vote are not real unlikely and they are more likely than previously.
They are still not the most likely outcome though.
A new look at that is here...
Popular Vote vs. Electoral College 2024
I have left the old one...
Popular Vote vs. Electoral College
It occurred to me in doing this that what this situation amounts to, where the win is
in the Electoral College while losing popular vote. This is the same as Gerrymandering.
There are obviously 'wasted' Democrat votes. If you win by one vote that is 'efficient'.
Winning by more that, the votes are wasted and it's inefficient.
This has been called an
Partisan Gerrymandering and the Efficiency Gap.
It is considered a sort of measure of the extent of Gerrymandering. It has
been used in legal cases to decide if states have been districted fairly. I have looked
at it some myself Gerrymandering below. Or, the web
page generated from my R coding is at Gerrymandering.
I am not saying anyone has purposely laid the states out to win presidential elections.
There is no need for an investigation or law suit. But I think just how things have turned
out demographically and geographically the Electoral College sometimes acts as
Gerrymandered for presidential elections. Using some of the data from above I would like
to calculate efficiency gaps to see to what extent this is true. Yet again, it seems like
it should be fairly simple.
I hadn't meant to upload anything until the Gerrymandering part was also done. But
since the Electoral College v. Popular is pretty much independent I am posting it first.
Consider it like a leaked Supreme Court decision at this point.
Election 2020
Electoral College vs. Popular Vote
There are interesting things starting to come out of the 2020 election besides the
Mueller Report, very much in the news today, and a platoon of Democrat candidates.
One thing that I just heard which got me
thinking was Elizabeth Warren making the elimination of the Electoral College in favor
of popular vote a campaign issue in her run for president. I got to
thinking this might not really be that good an idea. This page
Popular Vote vs. Electoral College did sort of turn out to be a defense of the
Electoral College as it is.
You might want to take a look if you're thinking 'the Electoral College is so 18th
century, let's just go popular'.
A MOOC course I took required signing up on Twitter. I don't use it, but I get emails
with potential items of interest from some recommender system. I glance at the emails
occasionally and coincidentally noticed this one in the last.
David Weakliem on the U.S. electoral college
So there is what I would have to call topical interest.
It's not like the subject is new though. From the
United States Electoral College Wikipedia.
Polls since 1967 have shown that a majority of Americans favor the president
and vice president being elected by the nationwide popular vote, instead of by the
Electoral College.
So, it's yet to be seen if having Democrat Presidential candidates favoring it makes
any difference now.
The github project is
Election-2020
Electoral College Upsets
I was watching the Reidout show on MSNBC and Steve Kornacki was as usual at the graphics
board explaining how some polling was currently much more favorable for Biden than
it had been for Clinton in 2016. After he finished Joy Reid said "I have one question".
I think she wanted to know if this indicated a definite win for Biden. I couldn't find the
video clip or transcript so hopefully I'm getting her meaning more or less correctly. I
assume she was concerned because of the 2016 election results. Either how the polling had
proven incorrect or by the Trump upset victory in the Electoral College.
The concerns are understandable, consider this from the 2016 election
Donald Trump Has A 20 Percent Chance Of Becoming President from FiveThirtyEight.
That right there was the conventional wisdom at the time. Trump was given pretty narrow
chances of winning. But as Nate Silver notes...
How do you predict a general election with Donald Trump?
We can think of a few basic approaches. One of them is to assert that precedent doesn’t
apply to this election and that Trump’s case is sui generis.
It’s not clear where that leads you, however.
First, you might wonder if the polls can be trusted. I've noticed that these polls generally indicate a margin
of error around 3 to 4 percent. So, if Biden is leading by more than that in the polls he
should win. However, polls can be wrong.
Why experts are getting presidential election polls wrong – again. These polls are based
on well founded and well understood statistics for things like proper sample sizes and where errors
might come from. But, they can still be wrong, especially it seems for Trump.
I was more interested in the possibility of another Electoral College win contrary to
popular vote. Specifically, how much of a popular vote lead would Biden need to be safe
from an Electoral College upset? I thought what I did above for election simulations could provide
a guesstimate answer to this. I took the same approach, running 10,000 random election simulations
based on recent presidential election results. Sort of a
Monte Carlo approach. Except this time I just paid attention to the Electoral College upsets,
when one side wins in the Electoral College while trailing in popular vote.
The average population difference is what the vote difference usually is when a electoral
college upset occurs. So, at 1,851,512, it means that upsets tend to happen with a vote difference of less
than 2 million. The max values are our guesstimates for what point the chance of an upset
pretty much goes to 0. So, for the democrats if they are losing in popular vote by more than
3,417,713 they have pretty much no chance of getting an electoral college upset win. However,
for the republicans they can be behind by up to 7,279,770 votes and still win in the
electoral college. I have had runs where that was up to about 9 million votes. In this regard
things clearly favor the republicans.
Next, I include the actual number of Electoral College upsets for each party. This is
followed by the probabilities for a upset and then upset probabilities for each party. This usually works out
as shown to about a 20% chance of a Electoral College upset win, with about a 4% chance of
a democrat win this way but about a 16% chance for a republican win. So again, advantage
republicans. I didn't notice that these could happen quite so often when I did the original
simulations. This is not what I would call a slim chance but seems to give republicans a
fairly substantial edge.
Finally, for the Clinton popular vote margin of 2,868,686 I calculate the probability
that she should of lost in a Electoral College upset. This usually comes up as shown between
4 and 5 percent. A fairly low chance, unless maybe Trump is involved.
A histogram for the simulations is included
Upset Elections
I think maybe the question comes down to the one in the movie "Marathon Man".
Is it safe?
In the movie Dustin Hoffman didn't really know what the question was about. With Trump I don't
know if anyone really knows. What do you think? Is it safe?
I would like it to be noted that I deleted all editorial comments that could be considered
as negative to Trump. Things like, why is he bragging about building 300 miles of wall
on a 1,954 mile border? Which Mexico did not pay for. Oh wait, there was an alternative fact
that Mexico paid for it out of some trade deal.
I deleted all the stuff like that right out.
One other thing of interest I came across in doing searches for this was this...
Clinton wins US popular vote by widest margin of any losing presidential candidate
which includes a Trump tweet...
In addition to winning the Electoral College in a landslide,
I won the popular vote if you deduct the millions of people who voted illegally
That was one he won. So it should not be a surprise that he is already talking about voter fraud
in the millions for this election before it happens. Irregardless of foreign interference
or national voter suppression through postal service machinations.
Right after doing this Nate Silver of FiveThirtyEight
tweeted
something sort of similar.
Chance of a Biden Electoral college win if he wins the popular vote by X points:
0-1 points: just 6%!
1-2 points: 22%
2-3 points: 46%
3-4 points: 74%
4-5 points: 89%
5-6 points: 98%
6-7 points: 99%
Searching for that I see they had also had some anticipation of the 2016 popular vote /
electoral college split.
Merged upsets.Rmd and upsets.html into the github project
Election-2020
Last Minute 2020 Presidential Election Forecasting
I am mainly posting this if anyone has any, very, late interest in a couple of the number crunching
election forecasts links below. A Twitter email is what gave me the idea.
It included a reference to a brief article by Professor Andrew Gelman that I found of interest. What immediately
follows concerns that. Feel free to skip if you like.
I have been looking at this off and on for the last some days, it is now even more last minute than a Republican Supreme
Court nomination. I don't tweet but I am signed up and Twitter has taken to sending me
emails for things that might be of interest, and sometimes in fact, they are. I just
received one linking to this
Reverse-engineering the problematic tail behavior of the Fivethirtyeight presidential election forecast.
I'm not sure I agree with some of the criticism of fivethirtyeight.
Consider the first scenario it looks at. That is the unlikely circumstance that Trump wins New
Jersey, or 'conditioned' on Trump winning New Jersey as things are sometimes put in conditional
probability terms. Let's look at a picture of the fivethirtyeight
40,000 simulation results distribution for New Jersey.
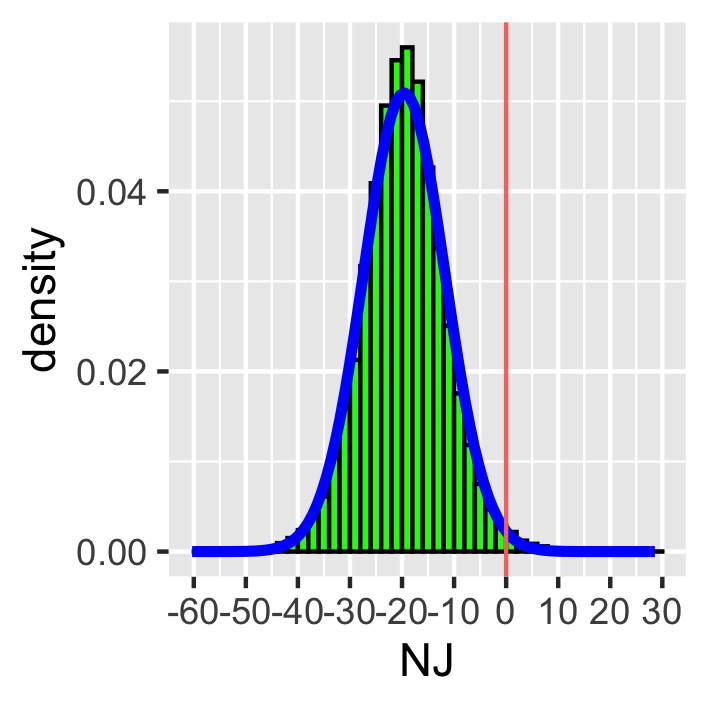
library(ggplot2)

nj <- state_sims[,"NJ"]

df <- data.frame(NJ = nj)

ggplot(df,aes(x=NJ)) +

     geom_histogram(aes(y=..density..),breaks = seq(-60,30, by = 2), colour="black",fill="green") +

     stat_function(fun = dnorm, colour="blue", size = 1.25, args = list(mean = mean(df$NJ),sd=sd(df$NJ))) +

     scale_x_continuous(breaks = seq(-60, 30, by = 10)) +

     geom_vline(aes(xintercept=0,color="red"), size=.5, show.legend = FALSE)
The blue curve fits a normal distribution to the results. I found it interesting how
closely the results follow this curve. Except in the very top region of the mean. Probably
the sweet spot the simulations are trying to target? The red line is at 0. To the left of
that line Biden wins and the little portion to the right of that is where Trump wins New Jersey.
Thats not a lot of tail. The high peaks at the mean are mentioned by the
commenter Rui
Professor Gelman indicates these usually are associated with "fat tails". Although again, there doesn't
really seem to be much tail.
There are 462 Trump wins. So 462/40000 = 0.01155, or slightly
more than 1% of the time.
In fact...
> (0 - mean(nj))/sd(nj)

[1] 2.498762
shows that the 0 even mark, is about 2 and a half standard deviations out. I have seen that 2 to 3 standard
deviations can be considered as outlier. So, what actually is being questioned here is the
behavior of an outlier. I don't believe you necessarily expect to get good
information from outliers.
Professor Gelman somewhat indicates this to be the case by saying things like
"highly unlikely" or "upset of the century". Later, he provides correlations that actually
show there isn't much of any correspondence between New Jersey and Alaska. He discusses how distance
seems to be the main source of correlation between states. Neighboring states correlate
more than distant states. His own forecast page on The Economist[1] has a
very nice interactive map showing state correlations. He seems to be leaning toward
correlations explaining some discrepancies but not sufficiently?
In starting to look at Professor Gelman's R one thing that gave me a little difficulty
was the use of trump_share, given as trump_share <- (state_sims + 1)/2. I'm
not quite sure why it is needed. I sort of assume it is a carry over from his own forecasts.
It is used in the calculation of correlations although doesn't seem to get a different
result...
> slice = subset(ss, NJ < 0)

> round(cor(slice[,"PA"], slice[,"NJ"]),2)

[1] 0.44


> trump_share <- (slice + 1)/2

> round(cor(trump_share[,"PA"], trump_share[,"NJ"]), 2)

[1] 0.44
Simce I am basing some of mine on his, I follow his convention and use trump_share for correlations.
It is correct that the NJ tail correlation for PA is different from the 0.44 above...
> slice = subset(ss, NJ > 0)

> trump_share <- (slice + 1)/2

> round(cor(trump_share[,"PA"], trump_share[,"NJ"]),2)

[1] -0.17
However, I saw in this
tutorial...
Finally, just because two variables are correlated at a particular range of values,
it should not be assumed that the same relationship holds for a different range.
I spent a little time looking at this thinking that I was onto some deep original
insight. Maybe correlation depended not only on state geographical distance but also
on distribution distance from the mean. However, when I started testing this the correlations
for some reason pretty much disappeared. I still haven't figured out why. The code currently
left at...
ss <- data.frame(state_sims)

ak <- c()

pa <- c()

rows <- c()

for (i in seq(-50,10,4)) {

    slice <- subset(ss, NJ > i & NJ < i+4)

    trump_share <- (slice + 1)/2

    rAk <- round(cor(trump_share[,"AK"], trump_share[,"NJ"]), 2)

    ak <- c(ak,rAk)

    rPa <- round(cor(trump_share[,"PA"], trump_share[,"NJ"]), 2)

    pa <- c(pa,rPa)

    rows <- c(rows,nrow(slice))

    print(paste0(i," AK ",rAk," ",nrow(slice)))

    print(paste0(i," PA ",rPa," ",nrow(slice)))

}
A couple closing intuitive thoughts.
This is being posed as a conditional probability type scenario. Given some unlikely,
tail event, how does this affect some other state? I think the more general question would
be given an unexpected event how many other of the 55 entries(states/districts) in the simulation might be
expected to have an unexpected result? Also, unexpected to what extent? How would this compare
if the conditioning (IIRC) state had a more expected, toward the mean, result? Also again,
for any given simulation with no conditioning how many unexpected results might be, uh,
expected? I would think there would be some non-zero expectation in all of these scenarios.
There seems to an underlying assumption, if I'm reading correctly, that if Trump
does unusually well in a Democrat leaning state that he should do even better in Republican
leaning states. This simply wouldn't be true in real life would it? To win New Jersey
Trump would have to shift considerably to the left of people he is fond of calling socialist.
This would likely not sit well with more conservative states in general would it?
Anyhow, given that the initial assumption is an outlier situation I don't really think this
is a major criticism of the fivethirtyeight forecasts. Although Professor Gelman denies it,
I sensed some fractious forecaster trash talking was implied. As an actual methodology for
reverse engineering how fivethirtyeight works it's simulations I am not knowledgeable
enough and didn't understand well enough to speak to.
I guess I'll leave it at that. I'm sure this has some people much more fired up for the
election. I may yet try to figure out how correlations might vary in different intervals
of the distributions. Some of the links I looked at considered correlation and regression.
Since this article concerned how predictive the results in one state should be for another
state, I may look at some regression. I had thought it could be interesting to try and put
something together on quantitatively what are the most important states? What states, that
are say polling somewhere inside or near the margin of error would change the most simulation
results depending on outcome. A different use of conditional maybe. Just the ones with the
most electoral votes? Obvious. Possibly there would be nothing more interesting there.
Also that one maybe won't be all that interesting in a couple of days when there are actual results.
LINKS
[1] Forecasting the US elections
[2] FiveThirtyEight 2020
If of any interest I did one more picture showing the AK and NJ distributions side by side.
nj_ak.png
It shows the push past normal at the peak. I'm still not sure I'm seeing fat tails?
That could be the picture.
ss <- data.frame(state_sims)

state <- c( rep("AK",40000), rep("NJ", 40000) )

results <- c( ss$AK, ss$NJ)

ak_mean <- mean(ss$AK)

ak_sd <- sd(ss$AK)

nj_mean <- mean(ss$NJ)

nj_sd <- sd(ss$NJ)

hist_df <- data.frame(state,results)

ggplot(hist_df,aes(x=results, fill=state)) +

    geom_histogram( aes(y=..density..),color="#e9ecef", alpha=0.6, position = 'identity') +

       scale_fill_manual(values=c("red", "blue")) +

       stat_function(fun = dnorm, colour="black", size = 1, args = list(mean = ak_mean,sd=ak_sd)) +

       stat_function(fun = dnorm, colour=" black", size = 1, args = list(mean = nj_mean,sd=nj_sd)) +

       geom_vline(aes(xintercept=0), color="black", linetype="twodash", size=.5, show.legend = FALSE) +

       labs(fill="")


Gerrymandering

Sometime ago the issue of Gerrymandering and a way of measuring it called the "Efficiency
 Gap" got my interest. I put together this page -
 Gerrymandering.

This one I put in a separate folder within the github Election-2016 project. The link
to that folder would be

Gerrymandering github.


Election 2016


There was a lot of discussion about what caused the outcome of the 2016 presidential

election. I wasn't entirely convinced by any of it and attempted a little analysis of my
own. Election 2016.
The github project is
Election-2016.